Project Type
Scientific Infographic Design
Industry
Scientific Publishing
Objective
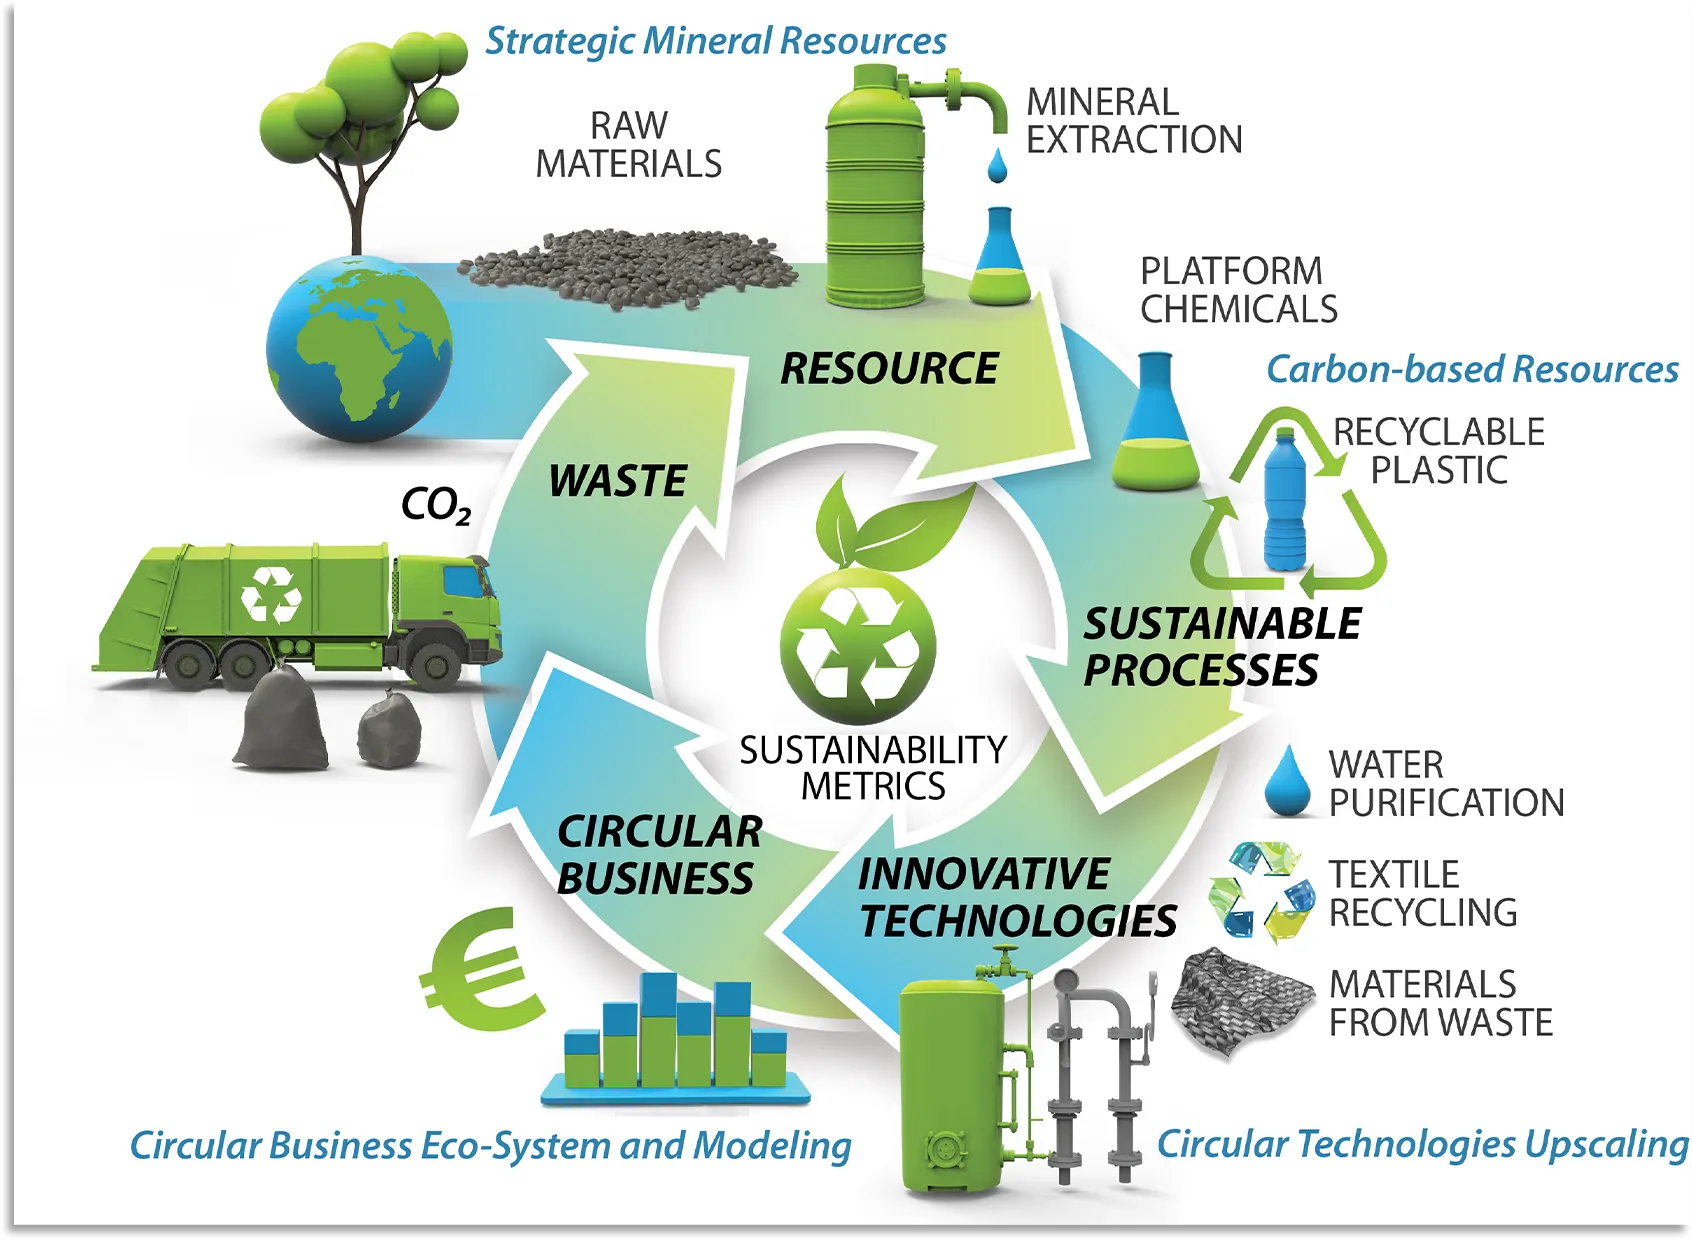
Create a clear and visually engaging infographic for a chemistry article that explains the circular use of resources, sustainable processes, and waste-to-value technologies.
Solution
The infographic uses a circular flow structure to illustrate the relationship between resources, waste, sustainable processes, innovative technologies, and circular business models. Supporting icons and labeled visual elements help communicate complex scientific ideas in a structured and accessible way.
Design Focus
Scientific data visualization, process flow illustration, information hierarchy, sustainability concept presentation, icon-based communication
Deliverables
Publication-ready infographic for a scientific article.
Tools:
Adobe Illustrator, Adobe Photoshop, Blender